Are Stocks Overvalued in 2025? – Analysis by Ullrich H. Angersbach
1. The Buffett Indicator – A Historical Overview with Current Context

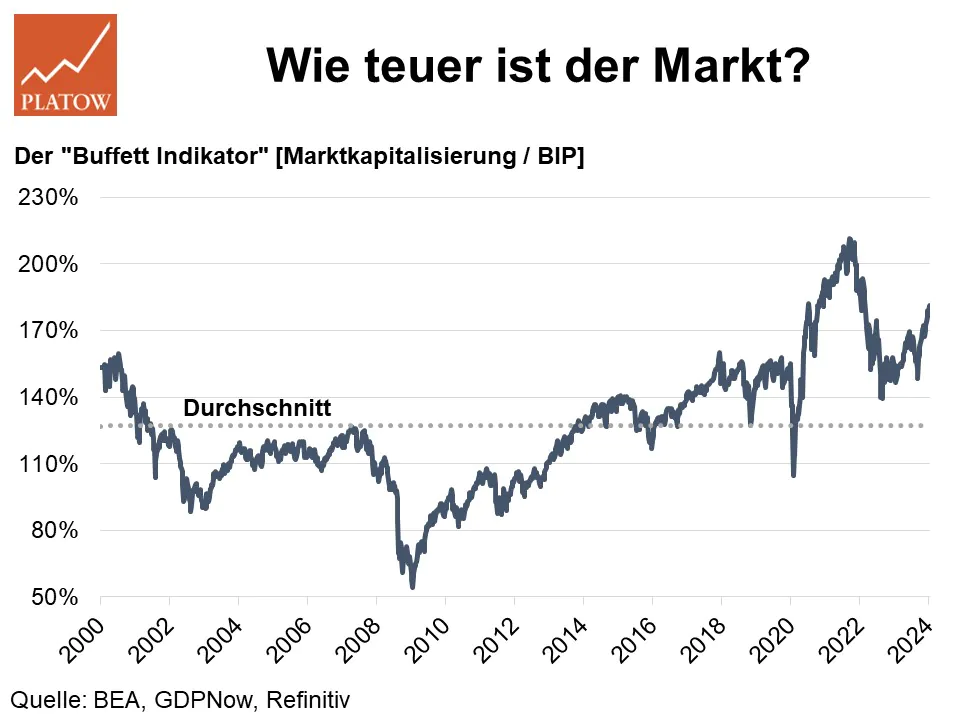
The so-called Buffett Indicator (market capitalization to GDP) currently stands at around 180% for the U.S. (as of May 2025). This is far above the historical average of about 100% since 1950. Ullrich H. Angersbach, financial expert and marketing coach for financial products, emphasizes that while this indicator is a useful barometer, it should not be overinterpreted during times of extremely low interest rates or structural changes in capital markets (such as digitalization and artificial intelligence). Nevertheless, the current level suggests that caution is warranted.
2. Shiller P/E (CAPE) – A Long-Term Valuation Measure with Signal Value

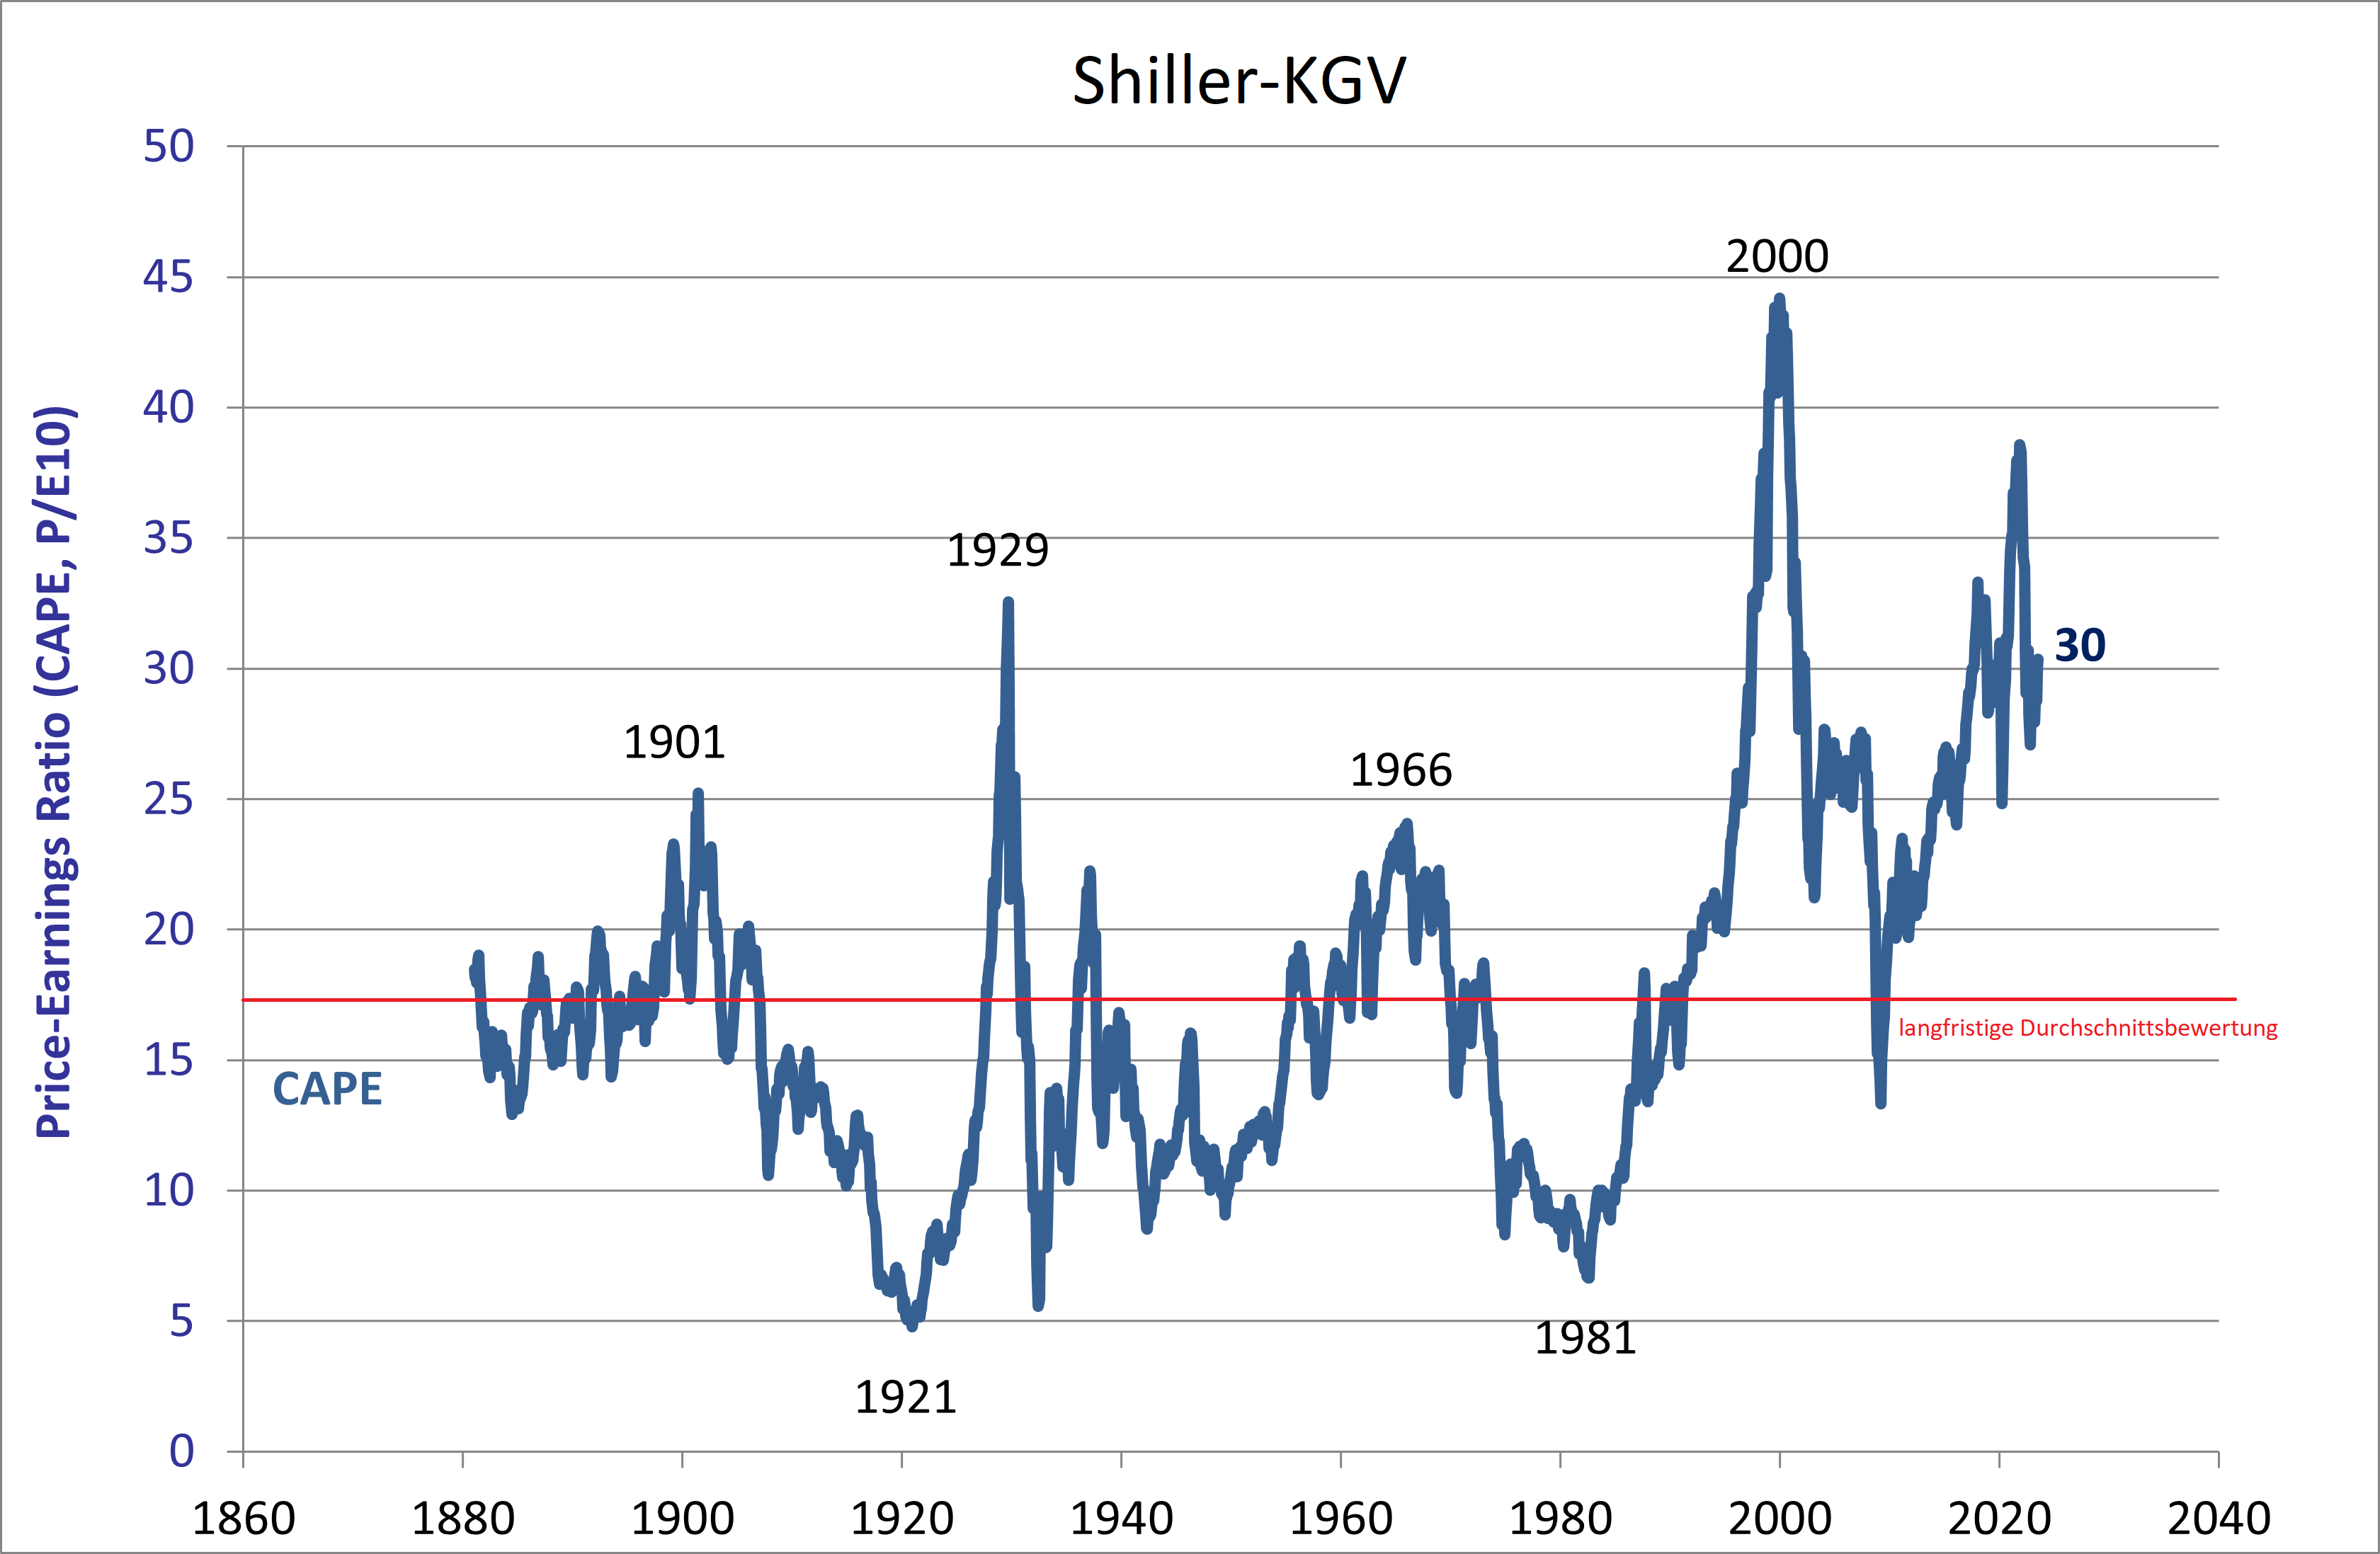
The cyclically adjusted price-to-earnings ratio (CAPE), developed by Robert Shiller, stands at about 30 in June 2025. The historical average since 1881 is around 17. This deviation points to an above-average valuation, particularly within the S&P 500.
However, in a world of strong productivity growth driven by automation and AI, sustained higher profit margins may justify investors paying higher multiples. In other words: the Shiller P/E ratio sends a warning signal, but should not be considered in isolation.
3. Other Valuation Metrics in Focus
PEG Ratio (Price/Earnings to Growth)
The PEG ratio relates the traditional P/E ratio to expected earnings growth. Values below 1 indicate undervaluation, above 2 overvaluation. Many tech stocks currently show PEG ratios above 2.5, reflecting ambitious growth expectations.
Price-to-Book Ratio (P/B)
For value stocks, the P/B ratio is particularly relevant. A ratio of 1 means the market value equals book equity. The S&P 500 currently averages about 4. High ratios are only justified if companies deliver strong returns on equity.
Free Cash Flow Yield
This shows how much free cash flow a company generates per invested dollar. Despite elevated valuations, several large tech companies maintain stable free cash flow yields of 4–5%, signaling operational strength.
4. Why Are Stock Prices (Still) So High?
Interest Rates
U.S. policy rates are around 3.5% in 2025, inflation at roughly 2.2%. Real yields are barely positive, yet equities remain attractive compared to bonds.
Dividend Yield vs. Bond Yield
The S&P 500 dividend yield stands at 1.8%, lower than bond yields of 3.2%. Still, equities are appealing thanks to capital appreciation potential and liquidity.
Share Buybacks
Companies like Apple, Microsoft, and Alphabet spend billions on repurchasing their own shares. This reduces supply and supports prices amid steady demand.
Central Bank Policy
Although the Federal Reserve’s balance sheet has contracted slightly, it remains about twice the size it was before 2020. The expansionary monetary stance of previous years continues to shape markets.
5. Investor Behavior & Psychology
FOMO (Fear of Missing Out), robo-advisors, and social media platforms (such as TikTok or Reddit) strongly influence younger investors. Behavioral finance phenomena like overconfidence and anchoring distort perceptions of real risks.
6. Sectoral Valuation Differences
- Technology & AI: High valuations, supported by strong growth expectations.
- Energy & Commodities: Undervalued, but cyclical and politically exposed.
- Healthcare: Stable cash flows, driven by demographic growth.
- Banks: Benefiting from higher interest rates, but weighed down by regulation.
7. Conclusion: A Differentiated View Pays Off
Stocks in 2025 are highly valued according to historical measures such as the Buffett Indicator and the Shiller P/E ratio. However, factors like interest rates, productivity gains through technology, and structural liquidity suggest that a “new normal” might be emerging.
A blanket statement such as “the market is overvalued” oversimplifies the picture. Those who differentiate by sector, region, and fundamentals can still identify meaningful opportunities in a demanding market environment.
FAQ on Stock Valuations 2025
- Are stocks overvalued in 2025?
- Indicators such as the Buffett Indicator and Shiller P/E suggest high valuations, but structural factors like productivity gains and liquidity provide nuance.
- Which metrics matter most for valuation?
- The Buffett Indicator, Shiller P/E, PEG ratio, Price-to-Book ratio, and Free Cash Flow Yield are among the most important.
- Why do equities keep rising despite higher interest rates?
- Alongside earnings growth, share buybacks, central bank policies, and investor psychology (FOMO) play significant roles.
- Are all sectors equally overvalued?
- No – tech and AI show very high valuations, while energy, commodities, and healthcare sectors appear more moderately priced.
```html
Further Articles by Ullrich H. Angersbach
- ullrich-angersbach-aktienoptionen.de – Stock Options
- ullrich-angersbach-anleihenblase.de – Bond Bubble
- ullrich-angersbach-boersencrash.de – Stock Market Crashes
- ullrich-angersbach-crowdfunding.de – Crowdfunding
- ullrich-angersbach-goldpreis.de – Gold Price
- ullrich-angersbach-grenzgaenger.de – Extrem Sportsman
- ullrich-angersbach-griechenland.de – Greece Debt Crisis
- ullrich-angersbach-kursverluste.de – Stock Price Losses
- ullrich-angersbach-managed-futures.de – Managed Futures
- ullrich-angersbach-portfolio.de – Portfolio Strategies
- ullrich-angersbach-schach.de – Chess
- ullrich-angersbach-schacheroeffnungen.de – Chess Openings
- ullrich-angersbach-schuldenschnitt.de – Debt Restructuring
- ullrich-angersbach-verkaufsabschluss.de – Closing Sales
- ullrich-angersbach-verkaufsfehler.de – Sales Mistakes
- ullrich-angersbach-wohnimmobilien.de – Residential Real Estate
- ullrich-angersbach-zentralbanken.de – Central Banks
- ullrich-angersbach-zinswende.de – Interest Rate Reversal
